Impact of League and Team on Player Wages in FIFA 22
Research Overview
This section examines the influence of leagues and teams on the wages of players in FIFA 22, utilizing data filtered to focus on specific top-tier leagues and selected teams within those leagues.
Data Preparation
Filtering Data to Top Leagues
To ensure the analysis was manageable and focused on high-profile areas of the game, we first narrowed our dataset to include only players from the top five European football leagues: English Premier League, Spanish Primera Division, German Bundesliga, Italian Serie A, and French Ligue 1.
Selecting Teams
From each league, five teams from top five leagues were randomly selected to provide a representative yet manageable group for detailed analysis. This selection was intended to balance the analysis across historically successful clubs and other significant but perhaps less dominant teams, providing a broader perspective on wage distribution across different levels of club success and popularity.
Code
top_leagues_players <- Fifa_22 %>%filter(league_name %in%c("English Premier League", "Spain Primera Division", "German 1. Bundesliga", "French Ligue 1", "Italian Serie A"))# Randomly select 5 teams from each leagueset.seed(123) # Setting seed for reproducibilityselected_teams_dataset <- top_leagues_players %>%group_by(league_name) %>%group_modify(~ .x %>%slice_sample(n =min(5, n_distinct(.x$club_name))))# Check the selected teamsprint(selected_teams_dataset)# Calculate average salary per team grouped by leagueaverage_salary_per_team <- selected_teams_dataset %>%group_by(league_name, club_name) %>%summarise(average_wage =mean(wage_eur, na.rm =TRUE),wage_sd =sd(wage_eur, na.rm =TRUE),min_wage =min(wage_eur, na.rm =TRUE),max_wage =max(wage_eur, na.rm =TRUE),count =n(), .groups ='drop')
Statistical Analysis
ANOVA Results
Following the data preparation, a two-way ANOVA was conducted to assess the effects of ‘league_name’ and ‘club_name’ on the wages of the players:
League Effect: With a p-value of 0.0509, the influence of the league on player wages is marginally significant, suggesting variations in wage structures across leagues.
Club Effect: The club impact, with a p-value of 0.0690, indicates variability in wages that also depends significantly on the club, though this effect is slightly less pronounced than that of the league.
Code
anova_result <-aov(wage_eur ~ league_name + club_name, data = selected_teams_dataset)summary(anova_result)
Regression Model Analysis
To further quantify the influence of league and club on wages, a linear regression model was applied:
Code
regression_model <-lm(wage_eur ~ league_name + club_name, data = selected_teams_dataset)summary(regression_model)
This model provides coefficients that quantify how much each league and each club contribute to the wage structure, beyond the categorical group effects tested by the ANOVA. Key results include:
League Contributions: Different leagues have different base salary levels, with coefficients indicating how much above or below the average league wage each league tends to pay.
Club Contributions: Clubs also show significant variability, with some paying substantially more or less than the league average, reflecting their financial strategies and market positioning.
Visual Analysis of Wage Distribution
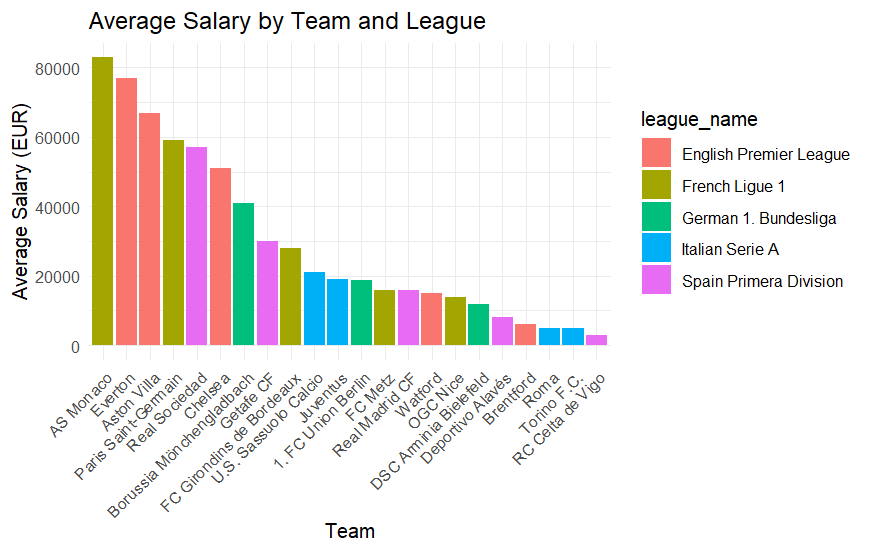
Average Salary by Team and League
This visualization reflects the average salary distribution by team within each selected league, illustrating the diversity of wage scales:
Code
ggplot(average_salary_per_team, aes(x =reorder(club_name, -average_wage), y = average_wage, fill = league_name)) +geom_bar(stat ="identity", position =position_dodge()) +labs(title ="Average Salary by Team and League", x ="Team", y ="Average Salary (EUR)") +theme_minimal() +theme(axis.text.x =element_text(angle =45, hjust =1))
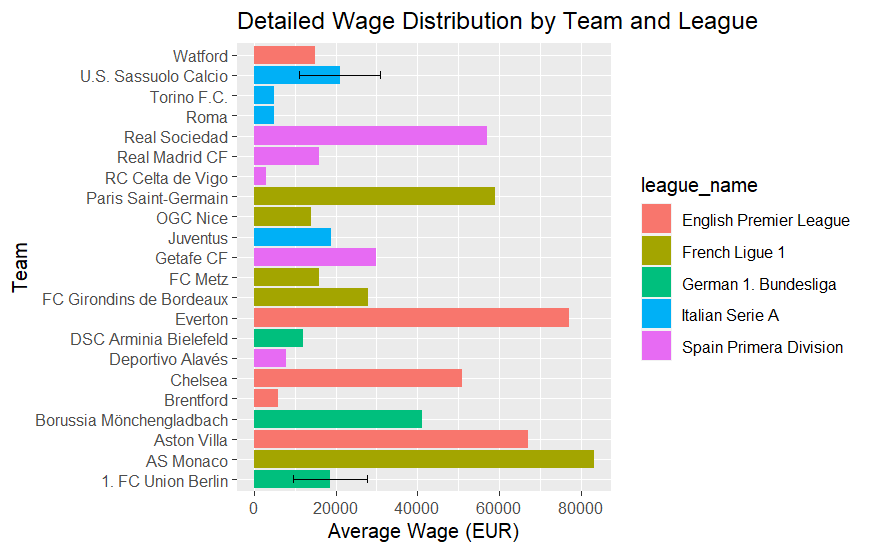
Detailed Wage Distribution by Team and League
Further detailed analysis of wage distribution by team and league highlights the spread and outliers, providing deeper insights into each team’s wage policy:
Code
ggplot(average_salary_per_team, aes(x = club_name, y = average_wage, fill = league_name)) +geom_col() +geom_errorbar(aes(ymin = average_wage - wage_sd, ymax = average_wage + wage_sd), width =0.4) +coord_flip() +# Flips the axes for better visualization of team nameslabs(title ="Detailed Wage Distribution by Team and League", x ="Team", y ="Average Wage (EUR)")
Conclusion
The filtered analysis, focusing on specific teams within the top five leagues, underscores significant variability in player wages influenced by both the league and the team. These findings assist in understanding how different football economies operate within the realm of FIFA 22.
Implications
Player Negotiations: This knowledge is crucial for players negotiating contracts in career mode.
Team Financial Strategy: Helps team managers in FIFA 22 plan financially, considering the typical wage structures of their league and competitors.